

Unlocking HR Insights
An effective HR metrics dashboard is crucial for data-driven decision-making. This listicle reveals seven essential metrics every HR team should track in 2025: Employee Turnover Rate, Time to Fill, Employee Engagement Score, Cost Per Hire, HR-to-Employee Ratio, Training ROI, and Revenue Per Employee. Understanding these KPIs provides insights into workforce health, productivity, and engagement, enabling you to measure HR initiatives and drive strategic change. By tracking these metrics, you can identify trends and make informed decisions that contribute to a stronger organization.
1. Employee Turnover Rate
Employee Turnover Rate is a crucial metric in any HR metrics dashboard, providing valuable insights into workforce stability and the effectiveness of retention strategies. It measures the percentage of employees who leave an organization within a specific period, helping HR departments identify potential issues that could impact business performance, culture, and the bottom line. This metric is essential for understanding the overall health of your organization and making informed decisions about talent management.
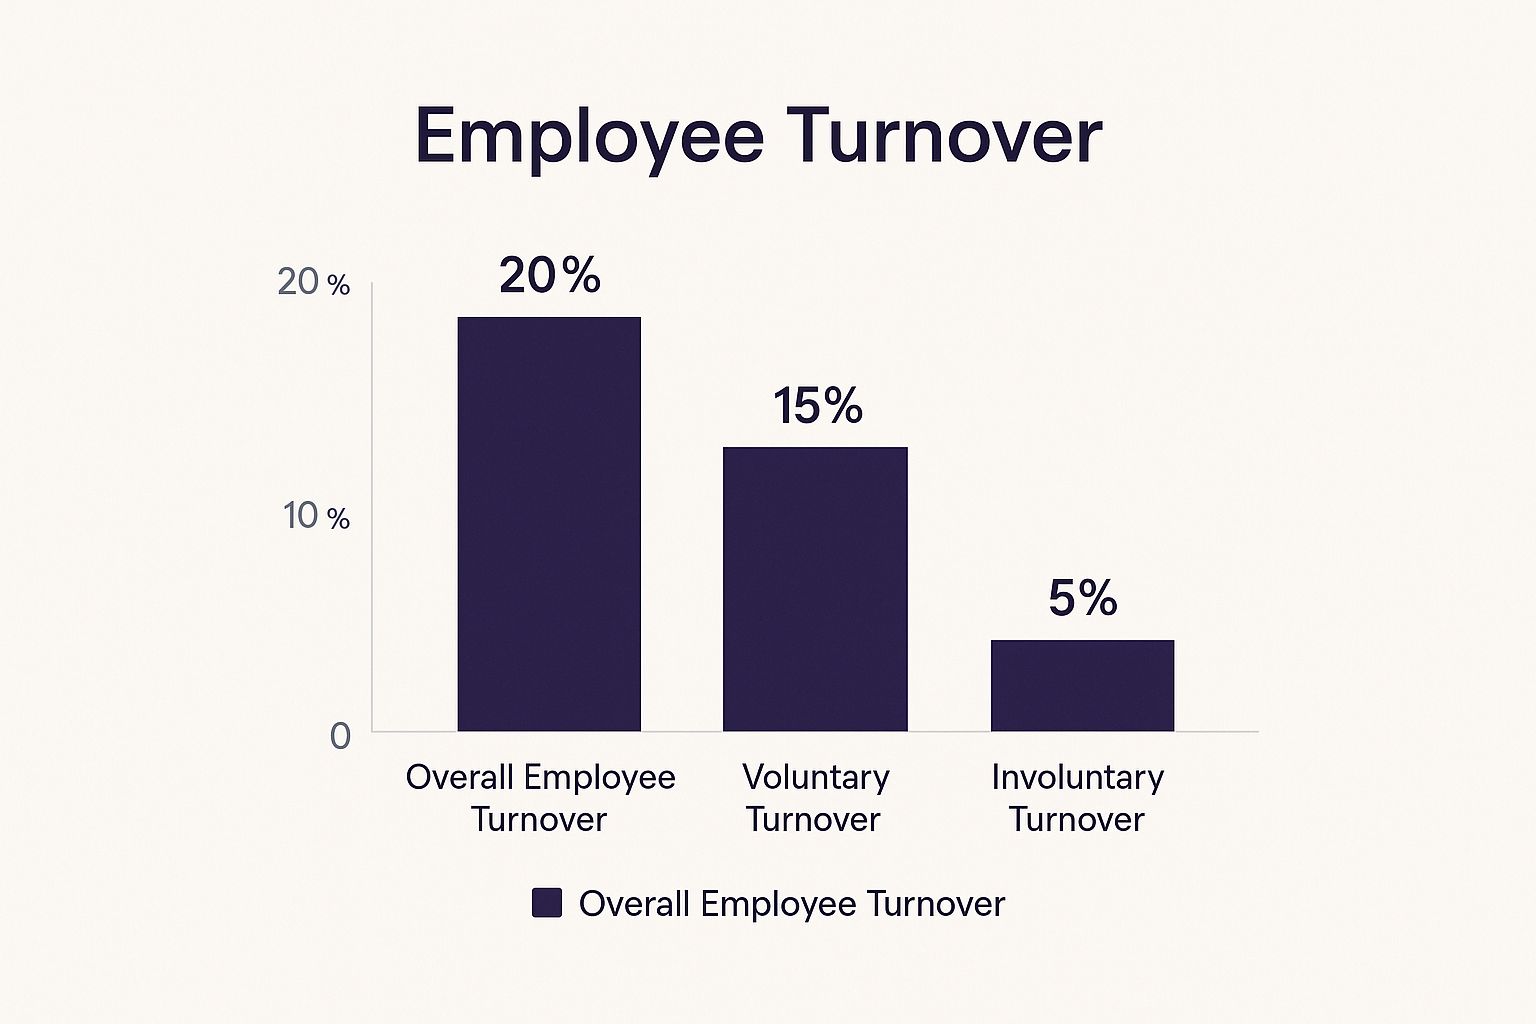
This infographic visualizes key data related to employee turnover, breaking it down by industry, tenure, and reason for leaving. For example, the chart highlights that the Tech industry experiences a higher average turnover rate compared to Healthcare, potentially due to increased competition and faster-paced work environments. It also shows that employees with less than one year of tenure contribute significantly to overall turnover, suggesting the importance of onboarding and early engagement initiatives. Finally, the visualization breaks down turnover by voluntary and involuntary reasons, enabling HR professionals to pinpoint specific areas for improvement.
The Employee Turnover Rate is calculated as (Number of Separations / Average Number of Employees) × 100. It can be segmented by voluntary vs. involuntary turnover, providing a more granular view of attrition patterns. Further analysis can be performed by department, role, tenure, and demographics, allowing HR professionals to identify specific areas of concern. This metric is typically measured monthly, quarterly, and annually, enabling trend analysis and early identification of potential problems. Benchmarking against industry standards also provides valuable context.
Features:
- Calculated as (Number of Separations / Average Number of Employees) × 100
- Segmented by voluntary vs. involuntary turnover
- Analyzed by department, role, tenure, or demographics
- Measured monthly, quarterly, and annually
- Benchmark comparison against industry standards
Pros:
- Clear indicator of organizational health
- Helps identify retention problems early
- Quantifies the financial impact of turnover
- Supports strategic workforce planning
- Provides insights into management effectiveness
Cons:
- Doesn't explain why employees are leaving
- High turnover in some roles may be normal for the industry
- Can be misleading without proper context (e.g., restructuring)
- Doesn't differentiate between high and low performers leaving
Examples of Successful Implementation:
- Google uses predictive analytics with turnover metrics to identify flight risk employees.
- IBM correlates turnover with engagement scores to predict departures.
- Zappos tracks turnover against their cultural fit assessment.
Tips for Using Employee Turnover Rate in your HR Metrics Dashboard:
- Calculate both overall and voluntary turnover separately.
- Compare against historical data, not just industry benchmarks.
- Pair with exit interview data for context.
- Set different targets for different departments.
- Visualize with trend lines rather than single points.
This metric deserves a prominent place in any HR metrics dashboard because it offers a high-level overview of workforce stability and flags potential retention issues. By monitoring and analyzing this metric, organizations can proactively address the root causes of attrition and improve employee retention. Learn more about Employee Turnover Rate This is crucial for HR Professionals and People Leaders, Business Executives and CEOs, Team Managers and Department Heads, Employee Engagement Specialists, and Organizations Focused on Culture Transformation alike. Understanding employee turnover is essential for building a thriving and sustainable organization. This metric was popularized by industry leaders like Josh Bersin, SHRM (Society for Human Resource Management), and Dave Ulrich.
2. Time to Fill
Time to Fill is a crucial metric within any HR metrics dashboard, offering valuable insights into the efficiency of your recruitment process. It measures the average number of days it takes to fill an open position, from the moment the job requisition is approved to when a candidate accepts an offer. This metric is essential for evaluating recruiting effectiveness, forecasting hiring timelines, understanding current labor market conditions, and ultimately, improving your overall talent acquisition strategy. By monitoring Time to Fill, organizations can identify bottlenecks, optimize their recruiting pipeline, and make data-driven decisions to improve their hiring processes.

Time to Fill is calculated by summing the number of days it took to fill each open position and dividing by the total number of positions filled: (Sum of Days to Fill Positions / Number of Positions Filled). This metric is often broken down further by position type, department, or location to provide a more granular view of recruitment performance. For example, filling a senior engineering role will likely take longer than filling an entry-level sales position. Analyzing Time to Fill by department can reveal if specific teams struggle with lengthy hiring processes. This detailed analysis allows HR and hiring managers to pinpoint areas for improvement and optimize strategies accordingly.
Features and Benefits:
- Comprehensive Measurement: Encompasses all days from requisition approval to offer acceptance, providing a complete picture of the hiring cycle.
- Granular Analysis: Can be segmented by position type, department, or location for targeted insights.
- Pipeline Stage Tracking: Allows for measuring time spent in each stage of the recruitment process, identifying bottlenecks.
- Benchmarking: Provides a benchmark for comparing internal performance against industry averages and competitors.
Pros:
- Clear Efficiency Metric: Provides a quantifiable measure of recruiting efficiency.
- Bottleneck Identification: Helps pinpoint slowdowns in the hiring process.
- Improved Workforce Planning: Enables more accurate hiring timeline projections.
- Data-Driven Decisions: Supports strategic adjustments to recruiting strategies.
- Realistic Expectations: Helps set realistic expectations for hiring managers.
Cons:
- Potential for Speed Over Quality: Overemphasis on reducing Time to Fill can compromise candidate quality.
- Limited Scope: Doesn't directly measure candidate quality or job fit.
- External Influences: External factors like labor market conditions can impact results.
- Varied Timelines: Different roles inherently require different hiring timelines.
Examples of Successful Implementation:
- Microsoft: Tracks Time to Fill by recruiter, hiring manager, and job family to identify top performers and areas for improvement.
- Salesforce: Leverages AI to predict Time to Fill, aiding in resource planning and proactive recruitment strategies.
- Unilever: Significantly reduced their average Time to Fill from 90 to 50 days by implementing digital assessments and streamlining their process.
Actionable Tips for Improving Time to Fill:
- Analyze Each Stage: Break down the time spent in each phase of the recruitment pipeline (sourcing, screening, interviewing, offer) to identify bottlenecks.
- Set Targeted Goals: Establish different Time to Fill targets for different role types and levels, acknowledging varying complexities.
- Contextualize with Time-to-Productivity: Compare Time to Fill alongside Time-to-Productivity to gain a holistic view of hiring effectiveness.
- Prioritize Quality: Track Time to Fill in conjunction with quality-of-hire metrics to ensure a balanced approach.
- Account for Seasonality: Consider seasonal variations in hiring patterns when setting targets and analyzing results.
Why Time to Fill Deserves a Place in Your HR Metrics Dashboard:
Time to Fill is a fundamental metric for any organization aiming to optimize its talent acquisition process. It provides valuable data for understanding recruiting efficiency, improving workforce planning, and making data-driven decisions. By incorporating Time to Fill into your HR metrics dashboard, you empower your organization to identify areas for improvement, reduce hiring costs, and ultimately, attract and hire top talent more effectively. This metric is particularly relevant for HR Professionals, People Leaders, Business Executives, Team Managers, and anyone involved in the hiring process. It also plays a critical role in organizations undergoing culture transformation, as efficient hiring is essential for bringing in individuals who align with the desired culture. This metric was popularized by thought leaders in the talent acquisition space like Talent Acquisition Executives (TAtech), Dr. John Sullivan, and Lou Adler, further emphasizing its importance in the field.
3. Employee Engagement Score
A key component of any comprehensive HR metrics dashboard is the Employee Engagement Score. This metric gauges the emotional commitment and connection employees feel towards their organization and its objectives. It provides valuable insights into employee sentiment and satisfaction, helping predict critical factors like productivity, retention, and overall company performance. By understanding and tracking engagement, organizations can proactively address potential issues and cultivate a thriving work environment.

Typically measured through anonymous employee surveys, the Employee Engagement Score often utilizes Likert scale questions (e.g., rating 1-5 or 1-10) covering key dimensions such as role clarity, growth opportunities, recognition, and trust in leadership. Many organizations also incorporate the eNPS (Employee Net Promoter Score) as part of their engagement assessment. These surveys are usually conducted quarterly or annually, providing regular snapshots of employee sentiment. Learn more about Employee Engagement Score
Features and Benefits:
- Comprehensive Measurement: Covers various aspects of the employee experience, offering a holistic view of engagement.
- Predictive Power: Strong correlation with business performance metrics, allowing for proactive intervention. It's a valuable predictor of future turnover and productivity.
- Diagnostic Tool: Helps identify underlying cultural and leadership issues impacting engagement.
- Actionable Insights: Provides data-driven insights for implementing targeted improvements.
- Benchmarking: Enables comparison against industry standards to gauge organizational effectiveness.
Pros:
- Strong correlation with business performance metrics.
- Predictive of future turnover and productivity.
- Helps identify cultural and leadership issues.
- Provides actionable insights for improvement.
- Allows for benchmarking against industry standards.
Cons:
- Subject to survey fatigue and response bias.
- Can be manipulated or influenced by timing (e.g., after bonuses).
- Results require careful interpretation and context.
- May not capture nuanced employee sentiments.
- Action plans can be difficult to implement effectively.
Examples of Successful Implementation:
- Airbnb: Uses weekly pulse surveys to track engagement in real-time, enabling rapid response to emerging trends.
- Salesforce: Correlates engagement scores with team performance metrics to demonstrate the impact of engagement on business outcomes.
- LinkedIn: Tracks engagement changes after implementing new policies, allowing for data-driven evaluation of policy effectiveness.
Tips for Effective Use in Your HR Metrics Dashboard:
- Include both quantitative scores and qualitative feedback options in your surveys.
- Focus on survey participation rate as a key metric, aiming for high representation.
- Share results transparently with employees to build trust and encourage dialogue.
- Create specific action plans for lowest-scoring dimensions, prioritizing areas for improvement.
- Conduct regular pulse surveys between major assessments to monitor ongoing trends.
- Compare scores across demographics (while maintaining anonymity) to identify potential disparities and tailor interventions.
Popularized By: The importance of employee engagement has been championed by thought leaders and organizations like Gallup (with their Q12 Assessment), Deloitte's Simply Irresistible Organization model, the Culture Amp platform, and Jim Harter (Chief Scientist at Gallup). Including this metric on your HR metrics dashboard demonstrates a commitment to fostering a positive and productive work environment, ultimately contributing to organizational success. This makes it an essential metric for HR Professionals, People Leaders, Business Executives, CEOs, Team Managers, Department Heads, Employee Engagement Specialists, and Organizations Focused on Culture Transformation.
4. Cost Per Hire
Cost Per Hire (CPH) is a crucial metric within any HR metrics dashboard, providing valuable insights into the financial efficiency of your recruitment process. It measures the average amount spent to fill a vacant position, encompassing both internal and external recruiting costs. Understanding your CPH helps optimize your recruitment budget, evaluate the return on investment (ROI) of various recruiting channels, and ultimately make data-driven decisions about your talent acquisition strategies. This allows HR professionals and business leaders to make informed choices that balance cost-effectiveness with attracting top talent.
CPH is calculated using a straightforward formula: (Total Recruiting Costs / Number of Hires) for a specific period. Total recruiting costs should include a comprehensive range of expenses, such as advertising costs, agency fees, employee referral bonuses, recruiter salaries and benefits, recruitment technology subscriptions, and even onboarding expenses. The Society for Human Resource Management (SHRM) advocates for a standardized formula that includes both internal and external costs, providing a more holistic view of recruitment spending.
Including CPH in your HR metrics dashboard is vital for several reasons. Firstly, it provides clear financial accountability for the recruiting function, allowing you to track spending and demonstrate the value of your efforts. Secondly, it helps identify cost-effective sourcing channels. By analyzing CPH across different channels, you can determine which sources deliver the best results for your investment. Finally, CPH supports budget planning and forecasting, enabling you to accurately project future recruitment costs and justify investments in new recruitment technologies.
Features and Benefits:
- Comprehensive Cost Inclusion: Calculates a holistic cost by considering internal and external factors, including advertising, agency fees, referral bonuses, recruiter costs, technology, and onboarding expenses.
- Segmented Analysis: Enables detailed analysis by allowing segmentation by department, role level, or hiring source, providing targeted insights.
- Standardized Formula: Utilizes the SHRM standardized formula encompassing both internal and external costs for consistent and comparable results.
- Benchmarking Capabilities: Facilitates benchmarking against industry averages, allowing organizations to assess their competitive standing in recruitment efficiency.
Pros:
- Provides clear financial accountability for recruiting efforts.
- Helps identify cost-effective sourcing channels.
- Supports budget planning and forecasting.
- Justifies investment in recruitment technology.
- Enables comparison of different recruiting strategies.
Cons:
- Can incentivize cost-cutting over the quality of hire if not balanced with other metrics.
- Difficult to standardize which costs to include, requiring careful consideration and consistency.
- Doesn't inherently reflect the value or quality of new hires.
- Some costs (e.g., internal recruiter time) can be difficult to allocate precisely.
- May vary significantly based on labor market conditions.
Examples of Successful Implementation:
- Google reduced their CPH by optimizing their employee referral program, demonstrating the effectiveness of leveraging internal networks.
- IBM uses AI to predict which recruiting channels will provide the best ROI, allowing them to allocate resources strategically.
- L'Oréal analyzes CPH against new hire performance over time to understand the long-term impact of their recruitment investments.
Actionable Tips:
- Track CPH alongside quality of hire and time-to-fill metrics for a balanced perspective.
- Break down costs by recruiting channel to identify areas for optimization.
- Consider the opportunity costs of vacant positions when evaluating CPH.
- Set different CPH targets for different roles, reflecting variations in market value and recruitment difficulty.
- Include onboarding costs for a complete picture of acquisition expenses.
- Establish a consistent methodology for CPH calculation to ensure accurate tracking and comparisons.
Learn more about Cost Per Hire
By effectively utilizing CPH data within your HR metrics dashboard, you can gain a deep understanding of your recruitment spending, optimize your processes, and ultimately improve your organization's ability to attract and retain top talent. This metric is essential for HR Professionals, People Leaders, Business Executives and CEOs, Team Managers and Department Heads, Employee Engagement Specialists, and organizations focused on culture transformation.
5. HR-to-Employee Ratio: Measuring HR Efficiency and Resource Allocation
The HR-to-Employee Ratio is a crucial metric featured on many HR metrics dashboards, providing a valuable snapshot of HR department efficiency and resource allocation. This metric, calculated as the number of HR Full-Time Equivalents (FTEs) divided by the total headcount, reveals the proportion of HR staff relative to the entire workforce. Understanding this ratio allows organizations to assess their HR operational effectiveness, benchmark against industry standards, and make informed decisions about HR structure and technology investments. This makes it an essential component of any comprehensive HR metrics dashboard.
How It Works:
The HR-to-Employee Ratio is typically expressed as the number of HR professionals per 100 employees (e.g., 1:100 means one HR professional for every 100 employees). This calculation can be applied to the entire HR department or segmented by function (e.g., recruiting, benefits, training). For example, you might track a separate ratio for recruiters to understand recruiting efficiency specifically. It's important to remember that this ratio can vary significantly based on industry, company size, HR operating model, and the complexity of the workforce. Typically, the HR-to-Employee ratio is measured annually as part of workforce planning activities.
Why Use This Metric in Your HR Metrics Dashboard?
Including the HR-to-Employee Ratio in your HR metrics dashboard allows you to:
- Assess HR Efficiency: A lower ratio can indicate greater efficiency in HR operations, particularly when coupled with other metrics demonstrating effective service delivery.
- Benchmark Against Competitors: Comparing your ratio to industry averages and competitors helps identify areas for improvement and understand how your HR staffing levels align with best practices.
- Justify Resource Allocation: Data-driven insights from this metric can support requests for additional HR headcount or resources, particularly when demonstrating the need for specialized roles.
- Guide HR Transformation: Understanding your current ratio can inform decisions related to restructuring, outsourcing, or technology implementation.
- Inform Technology Investments: The ratio can highlight opportunities to automate HR processes and improve efficiency through technology, ultimately justifying the investment.
Examples of Successful Implementation:
- IBM dramatically reduced their HR-to-Employee ratio from 1:100 to 1:275 through strategic implementation of HR technology, demonstrating the impact of automation on efficiency.
- Unilever recognizes the differing complexities across its global operations and maintains different HR-to-Employee ratios for various regions, highlighting the importance of context.
- Microsoft utilizes this metric to strategically determine the optimal locations for implementing shared service centers, driving cost savings and standardization.
Pros and Cons:
Pros:
- Simple and easy to calculate
- Facilitates benchmarking
- Supports resource allocation decisions
- Informs HR transformation initiatives
Cons:
- Doesn't measure HR effectiveness or business impact directly
- A lower ratio doesn't always equate to better service quality
- Doesn't account for outsourcing or automation impact directly
- Can fluctuate during periods of growth or restructuring
Actionable Tips for Using This Metric:
- Calculate both overall and functional-specific ratios. This provides a more granular view of HR resource allocation.
- Compare against companies of similar size and complexity within your industry. This ensures a relevant benchmark.
- Consider this metric alongside HR service satisfaction metrics. A lower ratio shouldn't come at the expense of employee experience.
- Account for technology investments when benchmarking. Companies with advanced HR technology may operate efficiently with lower ratios.
- Adjust targets based on company growth phase. Rapid growth often requires increased HR support.
- Factor in the complexity of your workforce (global, regulated, unionized). More complex workforces often require higher HR staffing levels.
Popularized By: The HR-to-Employee Ratio is a widely recognized metric, championed by organizations such as the Society for Human Resource Management (SHRM), and often included in benchmarking studies by firms like The Hackett Group. Furthermore, Dave Ulrich's HR operating model emphasizes the importance of efficient HR service delivery, often assessed through metrics like the HR-to-Employee Ratio. By incorporating this metric into your HR metrics dashboard, you gain valuable insights into your HR department's efficiency and resource allocation, enabling data-driven decisions to optimize your HR operations and contribute to overall business success.
6. Training ROI
A key component of any comprehensive HR metrics dashboard is Training ROI (Return on Investment). This metric allows organizations to move beyond simply measuring training participation and delve into the actual financial impact of their learning and development (L&D) initiatives. By including Training ROI in your HR metrics dashboard, you gain valuable insights into the effectiveness of your programs and their contribution to overall business objectives, making it an essential tool for HR Professionals, People Leaders, Business Executives, CEOs, Team Managers, Department Heads, Employee Engagement Specialists, and organizations undergoing culture transformation.
Training ROI measures the financial return generated from investments in employee training programs. It helps quantify the business impact of learning initiatives, optimize training budgets, and demonstrate the value of human capital development. This is calculated as ((Benefits - Costs) / Costs) × 100%. The "Benefits" include tangible improvements such as increased productivity, reduced errors, and improved employee retention. "Costs" encompass both direct expenses (e.g., materials, instructors) and indirect expenses (e.g., employee time).
How it Works:
Training ROI is typically measured at the program, department, or organization level and is often assessed 3-6 months after training completion to allow sufficient time for the learned skills to be applied and impact performance. The process involves establishing clear baseline metrics before training begins. Where possible, using control groups (employees who don't receive the training) can help isolate the specific impact of the training program. Incorporating both quantitative (e.g., sales figures, error rates) and qualitative (e.g., employee feedback, manager observations) measures provides a more holistic view of the impact.
Features and Benefits:
- Quantifiable Impact: Translates learning outcomes into financial terms, demonstrating the value of L&D.
- Prioritization: Enables data-driven decisions about which training programs to invest in or expand.
- Budget Justification: Provides concrete evidence to support L&D budget requests and demonstrate responsible resource allocation.
- Business Alignment: Directly connects HR activities to business outcomes, showcasing the strategic role of L&D.
- Strategic L&D: Supports the development of a data-driven L&D strategy focused on maximizing impact.
Examples of Successful Implementation:
Several organizations have successfully leveraged Training ROI to demonstrate the effectiveness of their L&D programs:
- IBM: Calculated a remarkable 270% ROI on their management development program.
- Motorola: Tracked $30 in productivity gains for every $1 spent on training.
- Accenture: Measures training ROI through performance improvement KPIs.
Pros:
- Quantifies the business impact of learning programs.
- Helps prioritize training investments.
- Justifies learning and development budgets.
- Connects HR activities to business outcomes.
- Supports data-driven L&D strategy decisions.
Cons:
- Difficult to isolate training effects from other variables influencing performance.
- Challenging to monetize all benefits, especially soft skills development.
- Some valuable outcomes, like improved employee morale, are intangible and difficult to measure directly.
- Results may take time to materialize, requiring patience and long-term tracking.
- Different calculation methodologies can yield varying results, making comparisons challenging.
Actionable Tips:
- Establish clear baseline metrics before training begins.
- Use control groups when possible to isolate the impact of training.
- Incorporate both quantitative and qualitative measures for a holistic view.
- Consider Kirkpatrick's four levels of evaluation (reaction, learning, behavior, results) for a comprehensive assessment.
- Track metrics over multiple time periods to understand the long-term impact.
- Focus on business-critical skills with measurable outcomes.
Learn more about Training ROI
This metric deserves a prominent place in your HR metrics dashboard because it directly links learning and development efforts to tangible business results. By understanding the financial return on training investments, organizations can make informed decisions about resource allocation, program development, and overall L&D strategy. Influential figures like Jack Phillips (ROI Institute), Donald Kirkpatrick (Four Levels of Training Evaluation), Josh Bersin (learning analyst), and the ATD (Association for Talent Development) have further popularized the importance of measuring and optimizing Training ROI. Including this metric in your hr metrics dashboard will allow you to demonstrate the true value of your L&D programs.
7. Revenue Per Employee
Revenue Per Employee is a crucial metric within any comprehensive HR metrics dashboard, offering valuable insights into workforce productivity and the return on investment in human capital. It measures the average revenue generated by each employee, providing a high-level overview of how efficiently the organization utilizes its workforce. This metric helps HR professionals, business leaders, and department heads understand the connection between human capital and financial performance.
How it Works:
Revenue Per Employee is calculated by dividing the company's total revenue by the total number of employees. The formula is straightforward:
Revenue Per Employee = Total Revenue / Total Number of Employees
This calculation is typically performed on a quarterly and annual basis to track trends and identify areas for improvement. For a more granular analysis, the metric can be broken down by department, location, or business unit, allowing for targeted interventions and performance comparisons.
Why Use Revenue Per Employee in Your HR Metrics Dashboard?
This metric deserves a place on your HR metrics dashboard because it directly links HR initiatives to top-line business performance. By monitoring Revenue Per Employee, organizations can:
- Evaluate Workforce Productivity: Understand how efficiently employees contribute to revenue generation.
- Benchmark Against Competitors: Compare performance against industry peers to identify areas for improvement and competitive advantages.
- Assess Human Capital Investments: Evaluate the effectiveness of training, development, and other HR initiatives aimed at enhancing employee performance.
- Inform Strategic Decision-Making: Provide data-driven insights for resource allocation, workforce planning, and overall business strategy.
Features and Benefits:
- Simple to Calculate and Understand: The straightforward formula makes it easily accessible to all stakeholders.
- Clear Picture of Workforce Efficiency: Provides a concise overview of how effectively the workforce generates revenue.
- Comparison Across Time Periods: Tracking Revenue Per Employee over time reveals trends and highlights the impact of HR initiatives.
- Justification for Investments: Supports budget requests for training programs and technology by demonstrating their impact on revenue generation.
Pros:
- Easy to calculate and interpret.
- Provides a clear indicator of workforce efficiency.
- Useful for benchmarking and performance comparisons.
- Helps justify investments in employee development.
- Directly connects HR metrics to business outcomes.
Cons:
- Doesn't account for outsourced work or contractors.
- Can be influenced by external factors outside HR's control (e.g., market conditions, pricing strategies).
- May not be comparable across industries with vastly different business models.
- Can encourage short-sighted headcount reductions without considering long-term implications.
- Doesn't factor in profit margins or employee costs.
Examples of Successful Implementation:
- Apple: Reports remarkably high revenue per employee, often exceeding $2 million.
- Netflix: Monitors Revenue Per Employee as a key performance indicator for evaluating its workforce efficiency.
- Microsoft: Utilizes this metric to compare the performance of different business units.
Actionable Tips for HR Professionals and Business Leaders:
- Track alongside profit per employee: Gain a more comprehensive understanding of profitability and the impact of employee costs.
- Consider employee costs when analyzing trends: Factor in salaries, benefits, and other expenses to gain a holistic view of workforce contribution.
- Compare against industry benchmarks: Focus on comparisons within your industry for more relevant insights.
- Use rolling averages to smooth seasonal variations: Avoid misinterpretations caused by temporary fluctuations.
- Break down by employee tenure: Assess the effectiveness of onboarding programs and identify areas for improvement.
- Factor in full-time equivalent (FTE) rather than headcount: Gain a more accurate representation of workforce contribution, especially in organizations with a significant number of part-time employees.
Popularized By:
The concept of focusing on productivity and efficiency, which underpins the importance of metrics like Revenue Per Employee, has been influenced by management theorists like Peter Drucker. Modern HR technology platforms, such as Workday Analytics, have facilitated the tracking and analysis of this metric. Publications like the annual Fortune 500 list often highlight company efficiency using metrics like Revenue Per Employee.
7 Key HR Metrics Comparison
| Metric | 🔄 Implementation Complexity | 💡 Ideal Use Cases | 📊 Expected Outcomes | ⭐ Key Advantages | ⚡ Resource Requirements |
|---|---|---|---|---|---|
| Employee Turnover Rate | Low - requires HRIS or manual tracking | Workforce stability, retention issues | Early retention problem detection, strategic planning | Clear organizational health indicator | Moderate - HR data, exit interviews |
| Time to Fill | Medium - needs recruitment process tracking | Recruiting efficiency, hiring timeline planning | Identify bottlenecks, improve hire speed | Measures hiring process speed effectively | Moderate - ATS data, recruiter input |
| Employee Engagement Score | Medium - requires surveys and analysis | Employee satisfaction, culture improvement | Predicts productivity, retention, engagement trends | Strong link to business performance | High - survey tools, analysis resources |
| Cost Per Hire | Medium - financial and operational data needed | Recruitment budget optimization | Expense control, ROI on recruiting channels | Financial accountability for recruiting budget | Moderate to High - financial tracking systems |
| HR-to-Employee Ratio | Low - simple ratio calculation | HR operational efficiency, benchmarking | Resource allocation insights, justifies HR staffing | Simple, clear HR capacity indicator | Low - HR and total headcount data |
| Training ROI | High - requires benefit and cost analysis | Learning program evaluation | Quantifies training impact, supports investment decisions | Connects learning to business outcomes | High - training data, financial and performance metrics |
| Revenue Per Employee | Low - simple financial and headcount data | Productivity benchmarking, business efficiency | Workforce productivity insight, peer comparison | Directly ties workforce to revenue performance | Low - financial reports and headcount data |
Taking Action with Your HR Metrics Dashboard
Building a truly effective HR department requires more than just intuition—it demands data-driven insights. This article has explored seven essential metrics for your HR metrics dashboard: Employee Turnover Rate, Time to Fill, Employee Engagement Score, Cost Per Hire, HR-to-Employee Ratio, Training ROI, and Revenue Per Employee. Mastering these KPIs provides a comprehensive understanding of your workforce, allowing you to pinpoint areas of strength and weakness. By analyzing trends in these metrics, you can develop targeted strategies to boost employee engagement, optimize recruitment processes, and ultimately, improve your organization's bottom line.
These insights are crucial for everyone from HR professionals and team managers to business executives and CEOs. Understanding the cost of turnover, the efficiency of your hiring process, and the impact of training programs empowers data-driven decision-making across the organization. When departments understand the connection between HR metrics and overall business success, they can collaborate more effectively to achieve shared goals.
The true power of your HR metrics dashboard lies in its ability to drive meaningful change. Don't just collect data—use it to transform your HR practices and build a thriving, engaged, and productive workforce in 2025 and beyond. Ready to streamline your HR processes and unlock the full potential of your workforce data? Explore how Happily.ai can help you build a powerful and insightful HR metrics dashboard tailored to your organization's unique needs. Happily.ai provides the tools and insights to transform your HR data into actionable strategies, empowering you to create a happier and more productive workplace.